Bauducco
- State
- Florida
- Investment
- US$200M
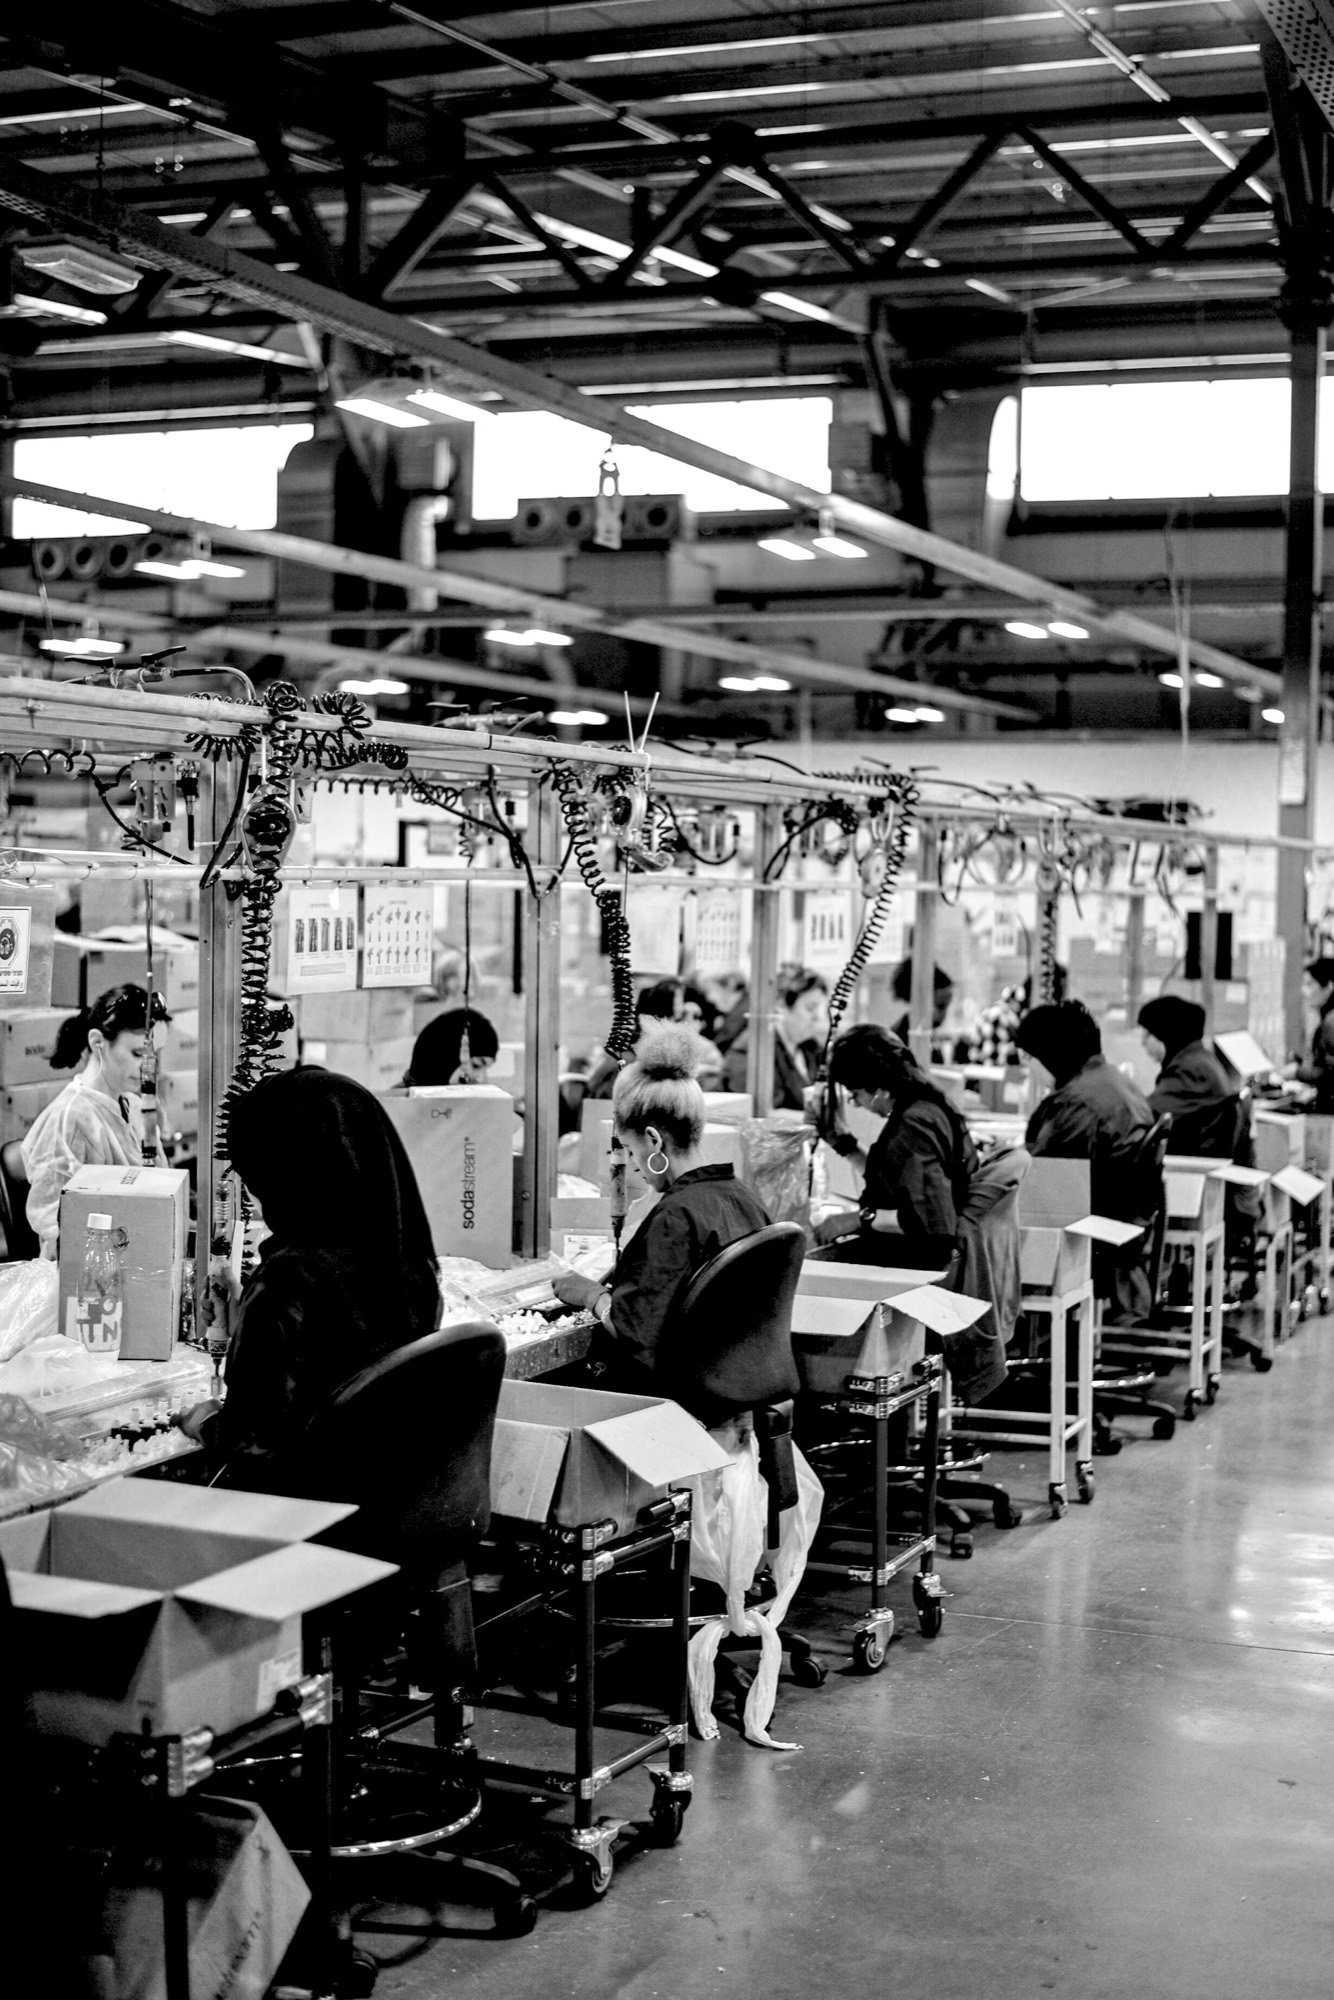
Its largest U.S. plant, in Zephyrhills near Tampa, began operating in 2026 and brings its wafers under a "Made in USA" label. Later phases are planned for 2028 and 2030, with up to about 600 jobs.
Investment · Article
Brazil's direct investment position in the United States reached US$37.9 billion in 2024, and Brazilian companies already produce in at least 23 states. We map where they are, in which sectors, who leads and what recent cases teach companies deciding whether to enter.
Brazilian direct investment position in the U.S. in 2024, by ultimate owner
BEA, via SelectUSA
U.S. jobs supported by Brazilian-owned affiliates, the most of any Latin American country
SelectUSA
Brazilian companies with some form of investment in the U.S.
CNI, 2025
U.S. states with at least one productive plant of a Brazilian company
CNI, 2025
Executive summary
Two measures coexist. The U.S. Bureau of Economic Analysis, which attributes each affiliate to its ultimate owner, puts the Brazilian position at US$37.9 billion in 2024. CNI, using a different method, estimates US$22.1 billion, up 52.3% in ten years. The ultimate-owner view also counts Brazilian investment routed through holding companies in third countries.
The position fell in 2022 and has grown again since, with net inflows of US$1.9 billion in 2023 and US$0.7 billion in 2024. The relationship is two-way: U.S. investment in Brazil reached US$88.0 billion.
Exhibit 1
Source: U.S. Bureau of Economic Analysis, via SelectUSA (Aug 2025).
Exhibit 2
Source: U.S. Bureau of Economic Analysis, via SelectUSA. Brazil in the U.S. by ultimate owner.
Florida concentrates the largest number of Brazilian plants, followed by Georgia and an industrial belt in the Midwest. Our reading: proximity to Brazil and ports explains Florida and the Southeast; the Midwest attracts industrial and food producers for its suppliers, logistics and customers.
Exhibit 3
Source: CNI (Jul 2025). Highlighted: the eight states detailed by CNI; at least 15 other states host one or more plants.
Capital is concentrated in food and beverages. By number of projects, the profile is more diverse: SelectUSA ranks software and IT services first, followed by financial services, food and beverages, business services, chemicals and communications.
Exhibit 4
Source: CNI (Jul 2025), based on fDi Markets. The balance is calculated as the remainder of the sectors detailed.
Seventy Brazilian companies announced projects in the U.S. between 2020 and 2025. The five largest add up to almost US$2 billion and span food, energy, steel and aerospace.
Exhibit 5
Source: CNI (Jul 2025), based on fDi Markets.
Four moves that show the logic behind Brazilian production in the U.S.
Its largest U.S. plant, in Zephyrhills near Tampa, began operating in 2026 and brings its wafers under a "Made in USA" label. Later phases are planned for 2028 and 2030, with up to about 600 jobs.
First U.S. factory, in Eden, making voltage regulators for the power grid, with about 160 jobs and production from the fourth quarter of 2026. The state grant is tied to investment and hiring targets.
Expansion of its transformer plant in Washington, Missouri, raising capacity by 50% to serve industry, the grid and data centers. In 2026 it announced US$165 million more for generators in North America.
Aircraft maintenance center in Texas with 250 planned jobs, close to the customers who operate its fleet in the U.S.
Our analysis of the cases above, for companies weighing a U.S. operation.
About this article
Prepared by the Marroffino & Partners team of specialists in strategy and U.S. market entry.
To discuss these findings for your company, write to us or book a conversation with a partner.
Methodology and sources
Figures come from official U.S. data (BEA via SelectUSA), from CNI's mapping based on fDi Markets, and from company announcements reported by the trade press, checked on October 23, 2026. Where measures differ (BEA and CNI estimate the investment stock differently), both are shown.
This article is for information only and reflects public data available on October 23, 2026. It is not legal, tax or investment advice. Company figures are as announced and may change.